GED Math
Click on the subject you want to study!


|


|


|


|


|
Test-Taking Strategies & Solving Word Problems
Download this study guide for more practice with common math questions on the GED:
| ged_math_test_study_guide.pdf |
Whole Numbers
|
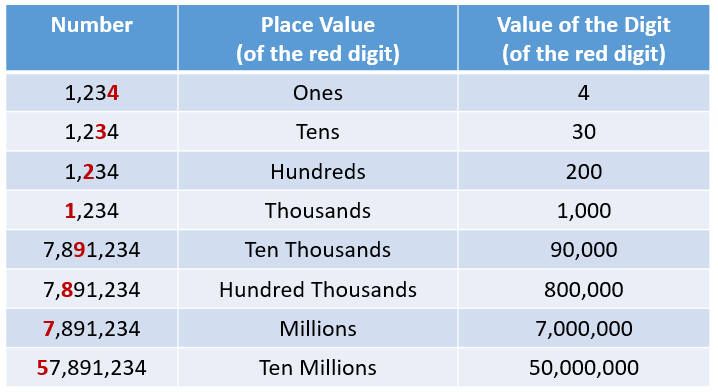
Whole numbers are written with the digits 0 through 9. The value of a digit in a whole number depends on its place. The value of a whole number is the sum of the values of its digits. When you write a whole number, place commas every three digits counting from right. Write a whole number in words just like you read it (for example, two hundred and twelve would be written numerically as 212). To compare and order whole numbers, compare digits that have the same place value. In some problems, you may need to round whole numbers to a certain place value. |
|
|
|
Quantities of whole numbers can be added to find a sum, or subtracted to find the difference. Multiplying different quantities finds the product, and dividing a quantity finds the quotient.
Download the GED questions to practice using whole numbers in operations and word problems:
| ||
Positive & Negative Numbers
|
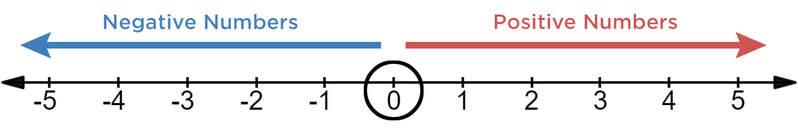
Positive and negative numbers are two broad classes of numbers that are used in math and also everyday transactions, like managing money or measuring weight.
|
|
Watch the video to learn the rules for adding, subtracting, multiplying, and dividing positive and negative numbers. Generally, it’s easier to perform operations on negative numbers if they are enclosed in brackets to keep them separate. Number lines (like the one pictured above) can make positive and numbers easier to understand, too.
| |||
Fractions
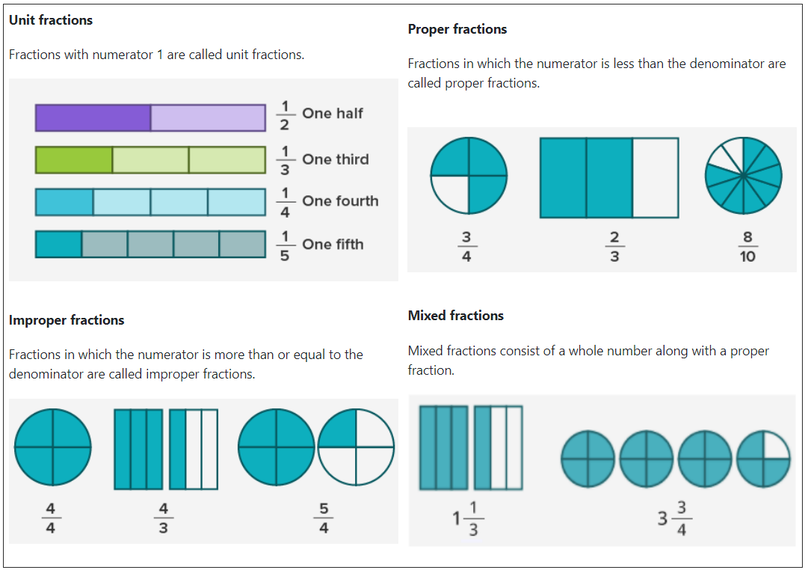
Fractions represent equal parts of a whole or a collection. A fraction has two parts. The number on the top of the line is called the numerator. It tells how many equal parts of the whole or collection are taken. The number below the line is called the denominator. It shows the total divisible number of equal parts the whole into or the total number of equal parts which are there in a collection.
Here's another way of looking at fractions: Half is one part out of two; one-third is one part out of three; three-fifths is three parts out of five, etc. From this concept, we can see that when the numerator and denominator is the same number, it means we want the whole thing. So a whole number can also be written as a fraction. Four out of four means we want all four parts. Six out of six means we want all six parts.
Types of Fractions:
|
|
|
Practice answering questions with fractions here. For more practice, download the GED fractions worksheet.
|
|
| ||||||
Proportions & Ratios
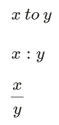
A proportion is an equation that says that two ratios are equivalent. For instance if one package of cookie mix results in 20 cookies than that would be the same as to say that two packages will result in 40 cookies.

A proportion is read as "x is to y as z is to w".
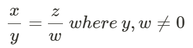
If one number in a proportion is unknown you can find that number by solving the proportion.
|
Practice using ratios and proportions here.
| ||||||
Scale Drawings
|
Practice scale drawings here.
|
A scale drawing is a drawing where the dimensions are proportional to the actual size of the object being drawn in a predetermined ratio. For example, if the scale is 1 cm : 3 in, then the length of 1 cm in the drawing represents 3 in in true, or original size. Read more about how scaling works by downloading the reading below, and then practice answering scale drawing questions for the GED:
| ||||||
Percentages
A percentage is a number that can be expressed as a fraction of 100. If we have to calculate percent of a number, divide the number by whole and multiply by 100. That is why percentage means a part per hundred. Percentages are represented by the symbol “%”.
|
Watch the videos below to learn more about how to solve math problems using percentages, and download the practice GED questions:
|
|
| ||||
|
|
|
Practice percentages here.
Probability
|
A probability is a number that reflects the chance or likelihood that a particular event will occur. Probabilities can be expressed as proportions that range from 0 to 1, and they can also be expressed as percentages ranging from 0% to 100%. A probability of 0 indicates that there is no chance that a particular event will occur, whereas a probability of 1 indicates that an event is certain to occur. A probability of 0.45 (45%) indicates that there are 45 chances out of 100 of the event occurring. Watch the video for more examples of probability, and download the GED practice questions below:
|
Practice probability here.
| ||
Decimals
|
|
A decimal is another way to write a fraction. It uses the base-ten place value system. You can compare and order decimals using place value. Decimals include place values such as tenths, hundredths, and thousandths. Decimals can represent amounts much smaller than 1. You can round decimals as you do whole numbers.
As with fractions, you can add, subtract, multiply, and divide decimal numbers. When you perform operations with decimals, you must pay close attention to the placement of the decimal point. For example, when you add or subtract, write the numbers so that the place values and decimal points align.
| |||||||
Charts & Graphs
|
Charts and graphs are used to organize and present data visually.
|
Watch the video to learn about how to read different charts and graphs, and then download the practice GED questions:
| ||
Data Analysis
As you read above, charts and graphs are useful ways to organize and analyze data. Some other important data analysis tools are finding the range, mean, median, and mode:
- The range is the difference between the highest and lowest values
- The mean is the average, which is found by adding together all of your values and dividing by the number of added
- The median is the middle number of the data set in order from least to greatest
- the mode is the number that occurred most often
|
|
|
Watch the videos to learn about ways to represent data, and find the mean, median and mode. Then download the practice GED questions:
| ||
Writing Algebraic Expressions
|
|
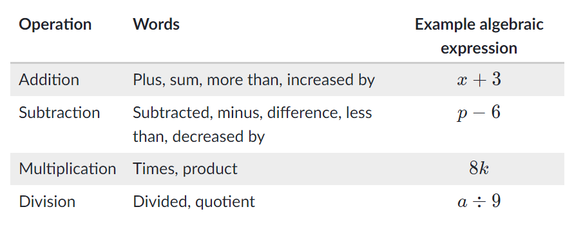
Sometimes in math, we describe an expression with a phrase. For example, the phrase "two more than five" can be written as the expression 5 + 2.
Similarly, when we describe an expression in words that includes a variable, we're describing an algebraic expression. For example, "three more than x" can be written as the algebraic expression x + 3. Algebraic expressions are useful because they represent the value of an expression for all of the values a variable can take on. |
|
Algebraic expressions use different words for addition, subtraction, multiplication, and division. Here is a table that summarizes common words for each operation:
Practice writing algebraic expressions on your own here, or download the worksheets below: |
|
|
| ||||
Evaluating Expressions
|
On the GED test, you will need to be able to evaluate expressions with two or more variables. For example, Let's say you want to evaluate the expression 10 + 2p - 3r. First you need to know the values of p and r. For example, to evaluate the expression when p = 4 and r = 5, we just replace p with 4 and r with 5.
10 + 2p - 3r = 10 + 2x3 - 3x5 = 10 + 8 - 15 = 3 So, the expression 10 + 2p - 3r equals 3 when p = 4 and r = 5. |
Practice evaluating expressions with two or more variables here.
|
|
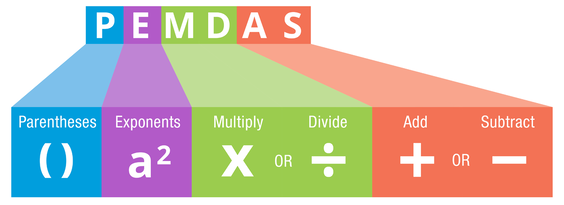
Remember, when solving expressions with two or variables, make sure to follow PEMDAS! Numbers and variables in parentheses are solved first; exponents are second; multiplication and division are third; and addition and subtraction are solved last. |
|
|
Download the worksheets for more practice writing algebraic expressions:
|
|
| ||||
Solving Equations
|
Practice solving equations here.
Download the worksheets for more practice writing solving equations:
|
An equation is a mathematical statement that shows an algebraic expression on each side of an equal sign. An equation may or may not contain variables. To solve an equation, find the value of the variable that makes the statement true. To do this, isolate the variable on one side of the equation. Perform inverse operations to isolate the variable. 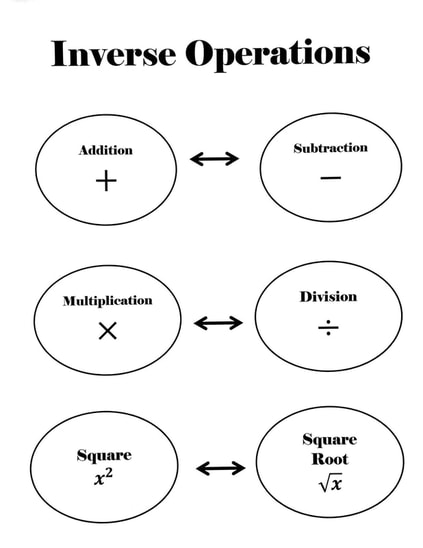
| ||||||
The Coordinate Plane
|
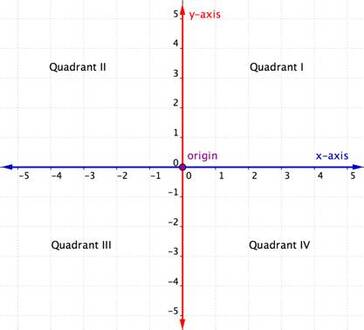
The coordinate plane is a two-dimension surface formed by two number lines. One number line is horizontal and is called the x-axis. The other number line is vertical number line and is called the y-axis. The two axes meet at a point called the origin. We can use the coordinate plane to graph points, lines, and more.
Download the worksheets for more practice using coordinate grids:
|
| ||
Graphing Linear Equations
A linear equation is the equation of a line. When you graph a linear equation, it’s best to write the equation in slope-intercept form: y=mx+b. Remember that m is the slope of the line and b is the y-intercept (the y-coordinate of the point at which the line crosses the y-axis).
If we write the equation in the form y=mx+b, we can first plot the y-intercept and then use the slope to find another point on the line. Technically, you need only two points to create a straight line, but plotting three or four points will create a more accurate graph if you’re graphing by hand.
If we write the equation in the form y=mx+b, we can first plot the y-intercept and then use the slope to find another point on the line. Technically, you need only two points to create a straight line, but plotting three or four points will create a more accurate graph if you’re graphing by hand.
|
Practice graphing linear equations here, and by downloading the worksheets:
|
|
| ||||
|
|
|
Slope & y-interceptThe slope-intercept formula is a way to describe the equation of a straight line (a linear function). It appears in the form of y=mx+b, where m and b are constants and y and x are variables.
|
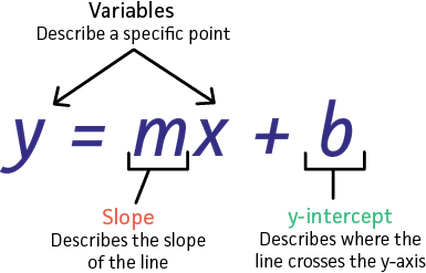
The m in the formula represents slope, which measures the steepness of a line. The b in the formula represents the y-intercept, which is the point where a line crosses the y-axis of a graph.
| ||||||
Solving & Graphing Inequalities
|
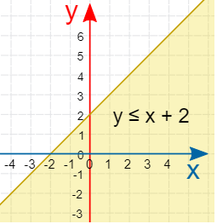
A linear inequality is like a linear equation (such as y = 2x+1), but it will have an inequality symbol like <, >, ≤, or ≥ instead of an =.
|
|
Exponents, Roots & Scientific Notation
|
More practice:
|
An exponent is small number written above and to the right of a number. The number underneath the exponent is called the base. Here's what an exponent and a base look like: 4³. In this example, the base is 4 and the exponent is 3. An exponent tells us to multiply the base by itself that number of times. In the example, 4³ tells us to multiply the base of 4 by itself 3 times. So 4³ = 4 x 4 x 4, and 4 x 4 x 4 = 64. The main reason we use exponents is because it's a shorter way to write out big numbers. So instead of writing 2 x 2 x 2 x 2 x 2 x 2, you can write 2⁶. The square root of a number is the factor that we can multiply by itself to get that number. The symbol for square root is √. Finding the square root of a number is the opposite of squaring a number.
For example: 4 x 4 or 4² = 16, so √16 = 4 If the square root is a whole number, it is called a perfect square. In this example, 16 is a perfect square because its square root is a whole number. Scientific notation is a way of expressing numbers that are too large or too small to be conveniently written in whole number or decimal form.
Large numbers can be expressed by taking a number between 1 and 10, and multiplying it by the power of 10. For example, 650,000,000 can be written in scientific notation 6.5 x 10⁸. Numbers less than 1 can be expressed by taking a number between 1 and 10, and multiplying it by the negative power of 10. For example, .000000065 can be written in scientific notation as 6.5 x 10⁻⁸. | ||||
Using the Quadratic Formula
|
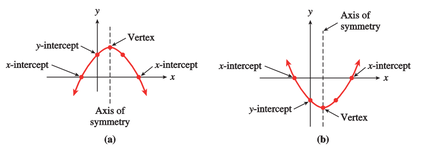
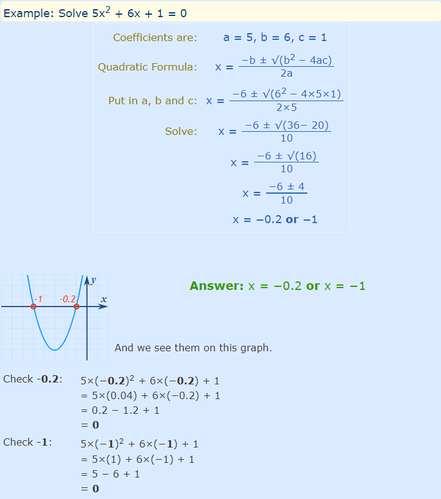
While a linear equation describes a line, a quadratic equation describes a parabola, or a U-shaped curve.
The standard form of a quadratic equation looks like this:
ax² + bx + c = 0
a, b, and c in the equation are known values, and a can never equal 0. x is the variable, or unknown. Use this website to see how changing the known values can affect the curve of the parabola!

The easiest way to solve a quadratic equation is to use the quadratic formula (pictured above).
Just take your known values (a, b, and c from the quadratic equation) and plug them into the formula.
|
|
Perimeter & Area of Triangles & Quadrilaterals
|
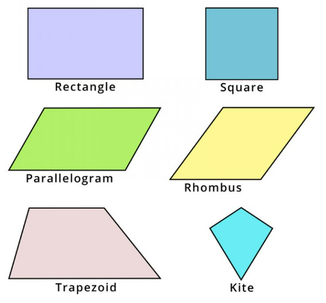
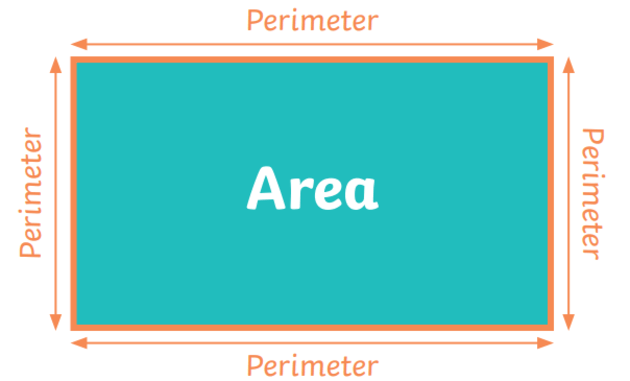
Perimeter is the length of a boundary of a figure. Whether the figure has three, four, five or more sides, it can be found by adding up the lengths of all the sides. Area is the amount of space occupied by a figure. In other words, it is the quantity that measure the number of unit squares that cover the surface of a closed figure. To find the area of a square, rectangle, or parallelogram, find the product of the base and height. The base can be the length of any side of the figure. The height is the length of a line segment perpendicular to the base. For a triangle's area, find the product of the base and height, and then divide by 2.
|
Practice finding the area and perimeter of different shapes here.
|
Watch the videos below to learn more about perimeter and area, and download the links for practice GED questions.
|
|
|
| ||||
|
Other quadrilateral shapes include the rhombus and trapezoid, which have their own methods for finding area.
The area of a rhombus can be found using the base x height formula, or it can be found using half the product of the two diagonals that go from corner to corner ( A = ½ × d1 × d2 ). The area of a trapezoid is found by multiplying half the height by the sum of the lengths of the bases ( A = ½h (b1 + b2) ).
|
| ||
Circumference & Area of Circles
|
A circle is a closed figure with no sides or corners. All points on a circle are equidistant from the center. The distance from the center of a circle to any point on the circle is called the radius. The diameter is the distance across a circle through its center. The diameter is always twice the radius. The distance around a circle is known as its circumference. To find a circle's circumference or area, you need to know either its radius or diameter. If you know the radius of a circle, you may double it to find the diameter. If you know the diameter of a circle, you may divide it by 2 to find the radius.
|

|
For any circle, the ratio of the circumference to the diameter (C/d) is always the same value, which is represented by the Greek letter π (pi). π is equal to about 3.14. So, since C/d = π, then the formula for calculating circumference is C = πd. The formula for calculating the area of a circle is A = πr², where r is the radius. In other words, the area of a circle is found by multiplying π by the square of the radius.
|
Watch the videos and click the link below to learn more about finding the circumference and area of circles. Download the GED worksheets to practice using the formulas yourself: |
| ||||
|
|
|
Study more about the circumference and area of circles here.
Pythagorean Theorem
|
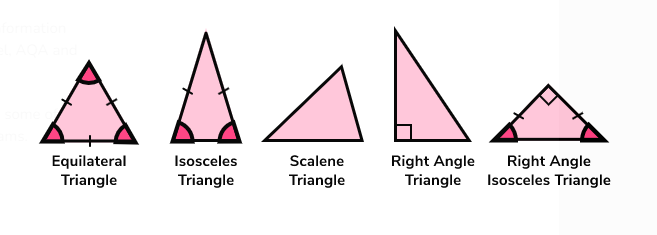
A right triangle is a triangle with a right angle. The legs (shorter sides) and hypotenuse (longer side) of a right triangle have a special relationship that can be described by the Pythagorean Theorem. It states that, in any right triangle, the sum of the squares of the lengths of the legs is equal to the square of the length of the hypotenuse. It is expressed in equation form as a² + b² = c². You can use this theorem to find the missing length of a right triangle.
|
|
Watch the video to learn more about the Pythagorean Theorem, or study more here.
Download the GED worksheet to practice yourself:
|
|

| ||
Volume
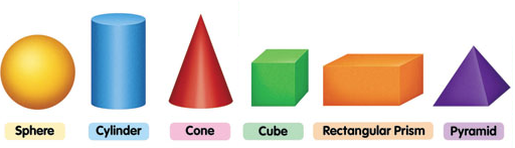
While area is the measure of space inside a two-dimensional figure, volume is a measure of the amount of space inside a three-dimensional object. Volume is measured in cubic units (cubic inches, cubic feet, etc.). Some common three-dimensional objects are rectangular prisms, cylinders, and spheres.
To find the volume of a rectangular prism, multiply the length times the width times the height.
To find the volume of a rectangular prism, multiply the length times the width times the height.
|
Spheres and cylinders have their own volume formulas.
Practice finding the volume of different objects here, or download the worksheet with practice GED questions: |
| ||